Multiple Choice
The figure below represents the sound wave for a pure tone. At 90°, there is: 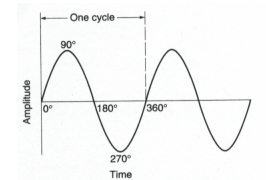
A) high atmospheric pressure and a high density of air molecules
B) high atmospheric pressure and a low density of air molecules
C) low atmospheric pressure and a high density of air molecules
D) low atmospheric pressure and a low density of air Molecules
Correct Answer:

Verified
Correct Answer:
Verified
Q24: The pinnae are responsible for:<br>A) equalizing the
Q25: Ear infections occur when:<br>A) the stereocilia have
Q26: Many structures in the auditory system are
Q27: Which of the following statements about amplitude
Q28: Which of the following statements about pure
Q30: Which of the following statements about the
Q31: Below is a figure displaying the anatomy
Q32: Fluid flows from the vestibular canal into
Q33: Below is a figure displaying the anatomy
Q34: The transduction of sound waves to neural