Multiple Choice
Consider the graph shown here. The equilibrium price level is: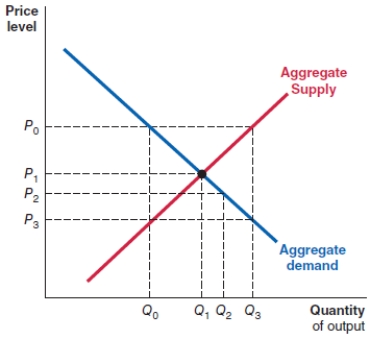
A) P3.
B) P2.
C) P1.
D) P0.
Correct Answer:

Verified
Correct Answer:
Verified
Related Questions
Q96: Holding other things equal, an increase in
Q97: You are an analyst preparing a forecast
Q98: Suppose that the Central Bank of Kenya
Q99: Explain the real wealth effect on consumption
Q100: An inflation-induced monetary policy response to lower
Q102: What is meant by the interest rate
Q103: Consider the graph shown here. The equilibrium
Q104: The stock market rises consistently and reaches
Q105: (Figure: Aggregate Demand) Use Figure: Aggregate Demand.
Q106: Expansionary monetary policy causes a:<br>A)right shift of