Multiple Choice
In May 2019, worries about U.S. tariffs on China caused the Chinese stock market to fall by 5.5%. Ceteris paribus, which of the graphs shows the correct effect on aggregate demand?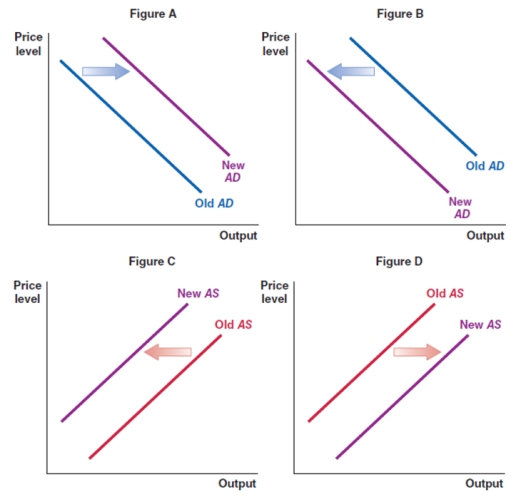
A) Figure A
B) Figure B
C) Figure C
D) Figure D
Correct Answer:

Verified
Correct Answer:
Verified
Q64: You are an analyst preparing a forecast
Q65: You are an analyst preparing a forecast
Q66: Given your knowledge of how aggregate supply
Q67: Suppose that Mongolian government engages in contractionary
Q68: Suppose that the Mexican government lowers personal
Q70: How does an increase in asset prices
Q71: On a macroeconomic scale, demand and supply
Q72: How do changes in each of these
Q73: Consumption is $13.7 trillion, investment is $4
Q74: Planned investment refers to the:<br>A)total investment.<br>B)intentional expenditures