Multiple Choice
Which graph correctly depicts the very short-run aggregate supply curve?
A) 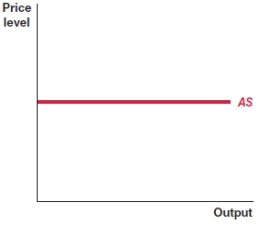
B) 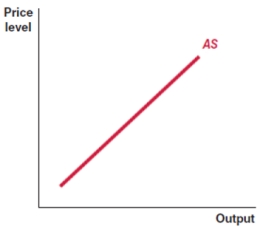
C) 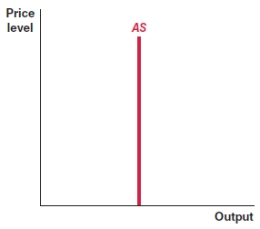
D) 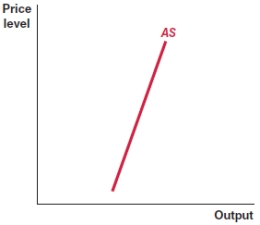
Correct Answer:

Verified
Correct Answer:
Verified
Related Questions
Q126: During the Great Depression, the U.S. economy
Q127: (Figure: Shifts of the AD-AS Curves) Use
Q128: (Figure: Shifts of the AD-AS Curves) Use
Q129: Prices of rubber and steel (inputs in
Q130: The aggregate supply curve shows the relationship
Q132: When the government raises government spending by
Q133: When the government increases spending, a multiplier
Q134: The exchange rate effect is the:<br>A)inverse relationship
Q135: You are an analyst preparing a forecast
Q136: In 2009, during the financial crisis, the