Multiple Choice
Which graph correctly depicts the long-run aggregate supply curve?
A) 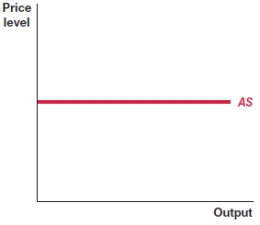
B) 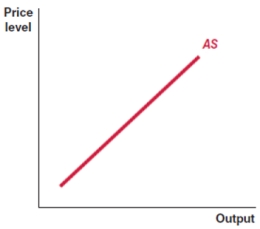
C) 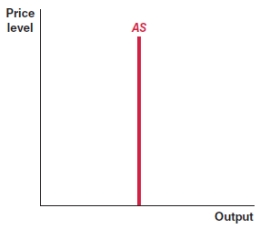
D) 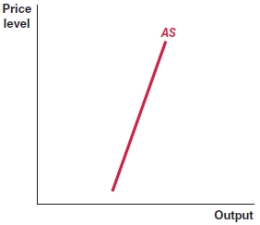
Correct Answer:

Verified
Correct Answer:
Verified
Related Questions
Q159: Explain the real wealth effect on consumption
Q160: Which of the following is true?<br>A)Because businesses
Q161: The debt effect helps explain the:<br>A)inverse relationship
Q162: Suppose that consumer expectations improve. This will
Q163: You are an analyst preparing a forecast
Q164: When the price level in an economy
Q165: When the aggregate price level _, people
Q166: The lower the GDP deflator in an
Q167: A rise in labor productivity will MOST
Q169: Consumption refers to the:<br>A)purchases of goods and