Short Answer
(Figure: Shift of the Aggregate Demand Curve) Use Figure: Shift of the Aggregate Demand Curve. An increase in aggregate demand is illustrated by a movement from:
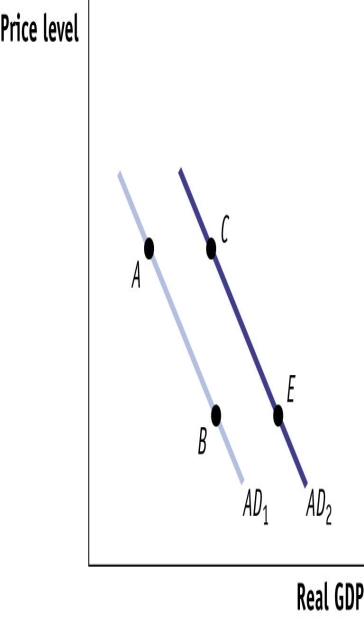
a. AD1 to AD2.
b. AD1 to AD2.
c. point C to point A.
d. point C to point A.
e. point B to point A.
f. point B to point A.
g. point C to point E.
h. point C to point E.
Correct Answer:

Verified
Correct Answer:
Verified
Q79: You are an analyst preparing a forecast
Q80: What is meant by sticky wages, and
Q81: In the long run, the aggregate supply
Q82: (Figure: Shift of the Aggregate Demand Curve)
Q83: Expansionary fiscal policy _ taxes, _ government
Q85: Explain the exchange rate effect relationship between
Q86: A fall in prices leads to a:<br>A)movement
Q87: The higher the prices in an economy,
Q88: In 2016, worries about the stock market
Q89: What is meant by the interest rate