Multiple Choice
Which of the following graphs correctly represents a negative supply shock on the Phillips curve?
A) 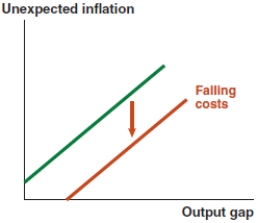
B) 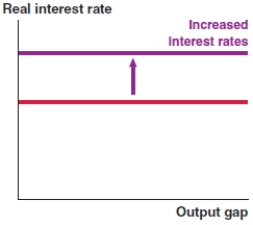
C) 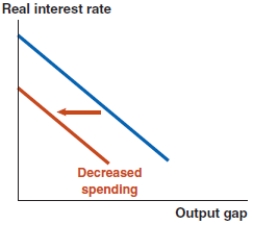
D) 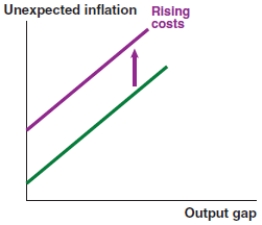
Correct Answer:

Verified
Correct Answer:
Verified
Related Questions
Q19: As part of a stimulus package, the
Q20: Once you have connected the output gaps
Q21: In the IS-MP analysis in the Fed
Q22: If a spending shock increases aggregate expenditure
Q23: If you see a newspaper headline that
Q25: Suppose net exports fall in South Africa.
Q26: If you see a newspaper headline that
Q27: Graphically depict how supply shocks affect the
Q28: If a spending shock reduces aggregate expenditure
Q29: Take a look at the IS-MP-PC model