Multiple Choice
Which of the following graphs correctly represents the effect of increased consumer confidence and spending on the IS curve?
A) 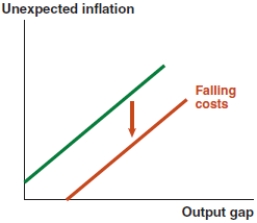
B) 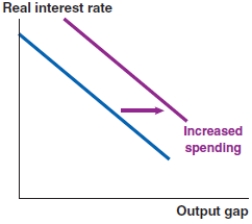
C) 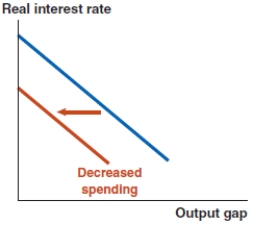
D) 
Correct Answer:

Verified
Correct Answer:
Verified
Related Questions
Q80: When using the Fed model to diagnose
Q81: Take a look at the IS-MP-PC model
Q82: Assume that a negative spending shock of
Q83: Describe the steps used to forecast an
Q84: The second step in analyzing a macroeconomic
Q86: If you see a newspaper headline that
Q87: In the IS-MP analysis in the Fed
Q88: A financial shock is any change in:<br>A)aggregate
Q89: Define the Fed model.
Q90: In the IS-MP analysis in the Fed