Multiple Choice
Which of the following graphs correctly represents the effect on the MP curve if lenders become less risk averse?
A) 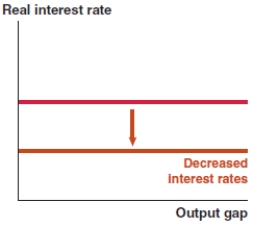
B) 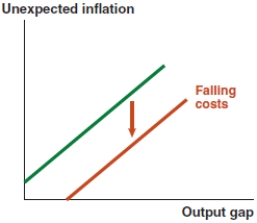
C) 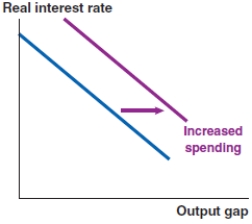
D) 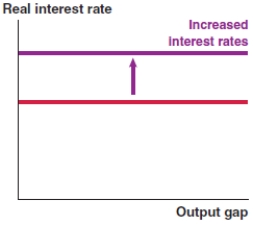
Correct Answer:

Verified
Correct Answer:
Verified
Related Questions
Q55: Take a look at the IS-MP-PC model
Q56: In the IS-MP analysis in the Fed
Q57: In the IS-MP analysis in the Fed
Q58: In the IS-MP analysis in the Fed
Q59: The economy shown here begins at a
Q61: Graphically depict how spending shocks affect the
Q62: The economy shown here begins at a
Q63: Tariffs on inputs lead to a _
Q64: The 1973 OPEC oil embargo is an
Q65: Take a look at the IS-MP-PC model