Multiple Choice
Which of the following graphs correctly represents the effect on the Phillips curve if there is widespread production technology improvement in Bangladesh?
A) 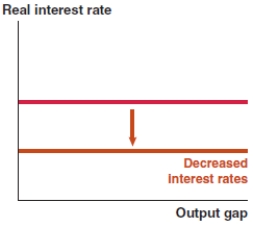
B) 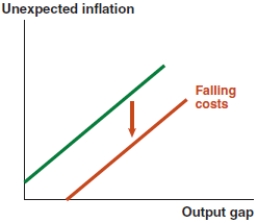
C) 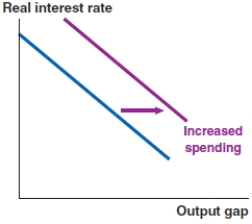
D) 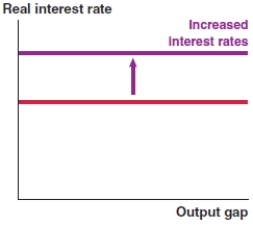
Correct Answer:

Verified
Correct Answer:
Verified
Related Questions
Q73: Once you have identified the point of
Q74: If a spending shock reduces aggregate expenditure
Q75: In the IS-MP analysis in the Fed
Q76: Classify the following as a financial shock,
Q77: In the IS-MP analysis in the Fed
Q79: In the IS-MP analysis in the Fed
Q80: When using the Fed model to diagnose
Q81: Take a look at the IS-MP-PC model
Q82: Assume that a negative spending shock of
Q83: Describe the steps used to forecast an