Multiple Choice
Which of the following graphs correctly represents the effect on the Phillips curve in India if the Indian rupee depreciates?
A) 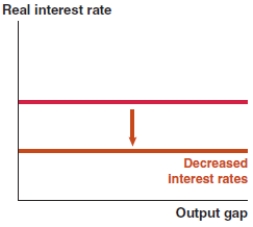
B) 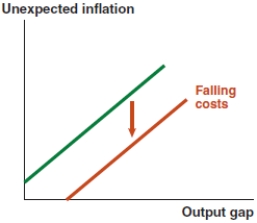
C) 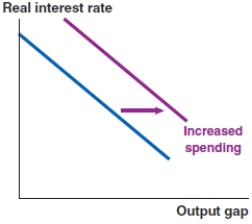
D) 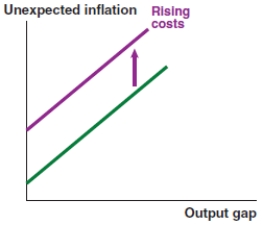
Correct Answer:

Verified
Correct Answer:
Verified
Related Questions
Q115: When using the Fed model to diagnose
Q116: Suppose that Banco de Mexico (Mexico's central
Q117: In the IS-MP analysis in the Fed
Q118: When a supply shock causes higher inflation
Q119: You are an economic detective. Using the
Q120: Assume that a positive spending shock of
Q122: In the IS-MP analysis in the Fed
Q123: Classify the following as a financial shock,
Q124: The economy shown here begins at a
Q125: The economy shown here begins at a