Multiple Choice
Which of the following graphs correctly represents the effect on the Phillips curve in Ethiopia if the Ethiopian birr appreciates?
A) 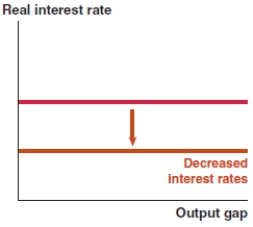
B) 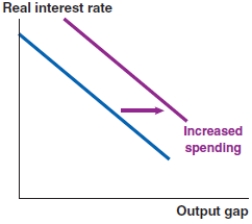
C) 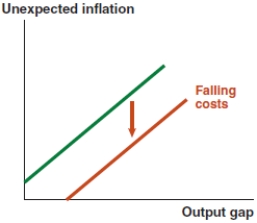
D) 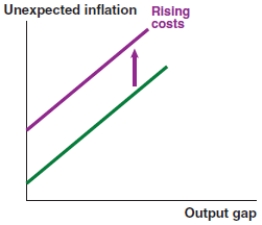
Correct Answer:

Verified
Correct Answer:
Verified
Related Questions
Q105: Take a look at the IS-MP-PC model
Q106: Assume that the economy starts at a
Q107: Take a look at the IS-MP-PC model
Q108: Holding everything else equal, India begins to
Q109: Take a look at the IS-MP-PC model
Q111: Suppose liquidity risk decreases. Analyze this shock
Q112: Take a look at the IS-MP-PC model
Q113: What are the steps for forecasting an
Q114: You are an economic adviser using the
Q115: When using the Fed model to diagnose