Multiple Choice
Which of the figures correctly represents the shape of the IS curve?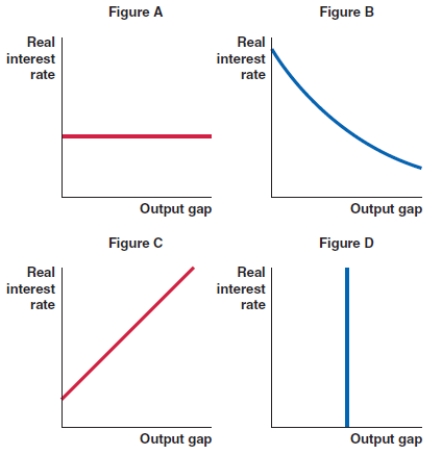
A) Figure A
B) Figure B
C) Figure C
D) Figure D
Correct Answer:

Verified
Correct Answer:
Verified
Related Questions
Q55: If the multiplier in the economy is
Q56: The MP curve is the:<br>A)current discount rate
Q57: How do interest rates affect investment in
Q58: The output gap is positive when:<br>A)monetary policy
Q59: Which of the following changes could create
Q61: Which of the following changes could create
Q62: Planned investment is the:<br>A)expenditure on goods and
Q63: If Y > AE:<br>A)the economy is producing
Q64: If government expenditure rises by $27.5 billion
Q65: If potential GDP is $7.04 trillion and