Multiple Choice
The table shows statistics for three Canadian cities at several different points in time. What was the unemployment rate in Montreal in January 2019?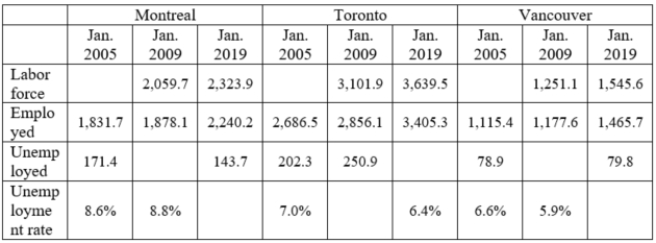
A) 8.8%
B) 6.2%
C) 93.8%
D) 5.4%
Correct Answer:

Verified
Correct Answer:
Verified
Related Questions
Q65: (Table: Employment Data) The number of persons
Q66: Which of following people can be classified
Q67: An underemployed person is one who is:<br>A)employed
Q68: Cyclical unemployment is a result of _.<br>A)recessions
Q69: (Table: Employment Data) The unemployment rate is
Q71: Cyclical unemployment is unemployment:<br>A)due to a temporary
Q72: (Figure: The Minimum Wage) Use Figure: The
Q73: Suppose a labor market is described by
Q74: Which of the following is a reason
Q75: David is looking for a full-time job