Multiple Choice
Consider these four graphs of the labor market, showing four different minimum wage levels. Which graph(s) shows a wage level where there is no unemployment?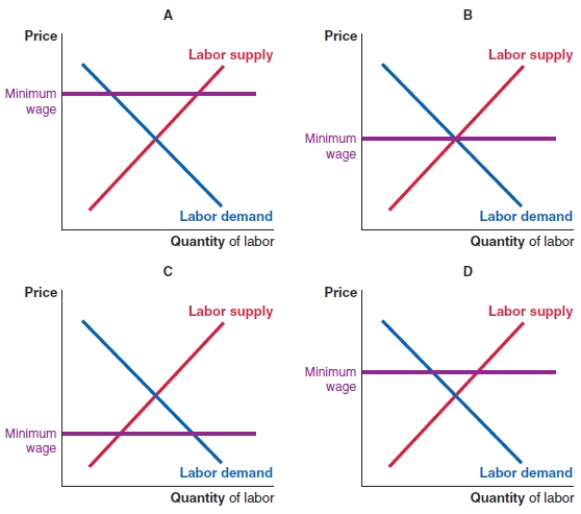
A) graphs A and D
B) graph B
C) graphs A and C
D) graph D
Correct Answer:

Verified
Correct Answer:
Verified
Related Questions
Q58: The equilibrium unemployment rate is also known
Q59: In 2019, 10 million people did not
Q60: The table shows labor market statistics for
Q61: A minimum wage that is above the
Q62: The table shows statistics for three Canadian
Q64: Consider the labor market shown here. Suppose
Q65: (Table: Employment Data) The number of persons
Q66: Which of following people can be classified
Q67: An underemployed person is one who is:<br>A)employed
Q68: Cyclical unemployment is a result of _.<br>A)recessions