Multiple Choice
Consider these four graphs of the labor market, showing four different minimum wage levels. Which graph(s) shows a wage level where there is an excess supply of workers?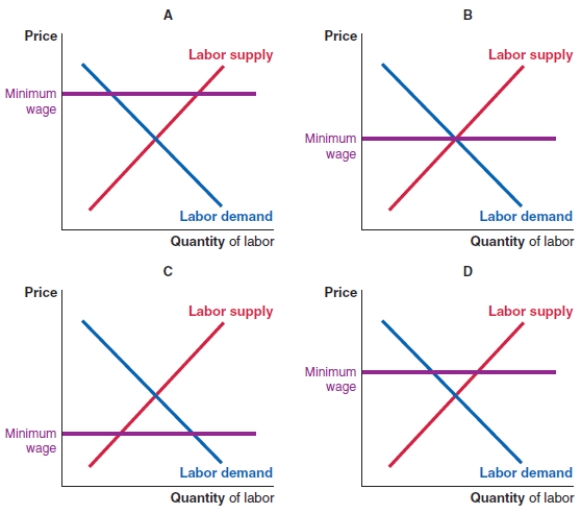
A) graphs A and D
B) graph B
C) graphs A and C
D) graphs B and C
Correct Answer:

Verified
Correct Answer:
Verified
Related Questions
Q98: List three things governments can do to
Q99: If a country has a working-age population
Q100: (Table: Labor Force Data) If the labor
Q101: Consider these four graphs of the labor
Q102: The equilibrium unemployment rate cannot be equal
Q104: (Figure: The Effect of a Minimum Wage)
Q105: In April 2019, the state of New
Q106: (Figure: The Minimum Wage) Use Figure: The
Q107: The table shows Canada's labor force
Q108: The table shows Canada's labor force