Multiple Choice
Consider the following graphs, which are discussed in the textbook. Focus on the graph that looks at the relationship between GDP per person and infant deaths per 1,000 live births. What can explain this relationship?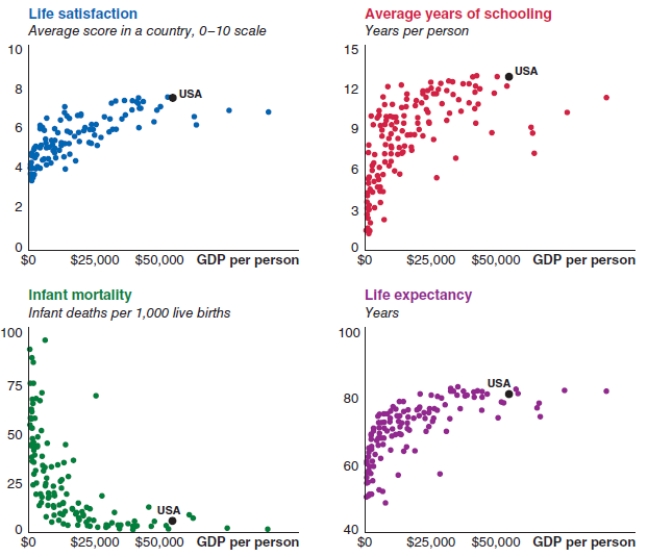
A) Infant mortality declines only when GDP per person is above $25,000 per year.
B) As real GDP per person rises, infant mortality rises.
C) As real GDP per person rises, maternal and fetal health increase due to better health care, education, sanitation, and nutrition.
D) As life expectancy increases, GDP per person increases at the same rate.
Correct Answer:

Verified
Correct Answer:
Verified
Q133: (Table: Real and Nominal Output) Use
Q134: In the United States, consumer spending accounts
Q135: (Table: Real and Nominal Output) Use
Q136: Which of the following is an example
Q137: Consider the data shown in the
Q139: Table: Measuring GDP. Use Table: Measuring
Q140: Consider the data shown in the
Q141: Which of the following is (are) included
Q142: A person opts for the solitude of
Q143: Consider the following data. Assume that