Multiple Choice
Consider the following graphs, which are discussed in the textbook. Focus on the graph that looks at the relationship between GDP per person and life expectancy. What can explain this relationship?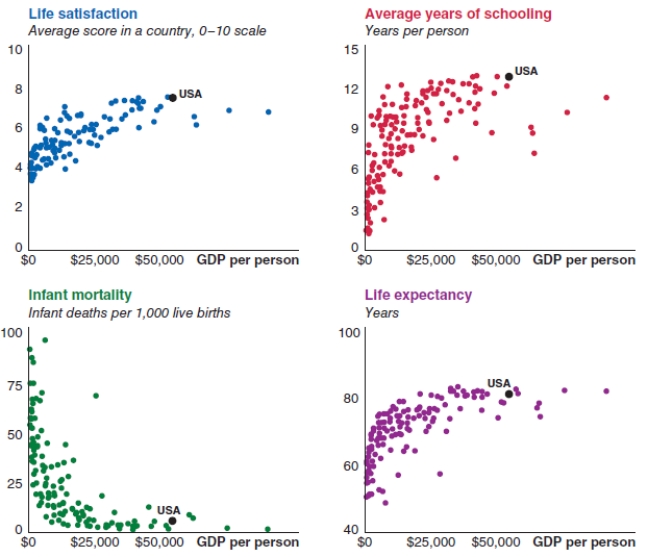
A) Higher income per person allows for better health care, sanitation, and nutrition.
B) Higher income per person leads to a higher mortality rate.
C) Lower income per person is a result of fewer years of schooling.
D) As life expectancy increases, GDP per person increases at the same rate.
Correct Answer:

Verified
Correct Answer:
Verified
Q71: Consider the data shown in the
Q72: The underlying principle of the circular flow
Q73: When your household buys goods and services,
Q74: (Table: Peanut Butter and Jelly Economy)
Q75: The topics studied in macroeconomics include:<br>A)inflation.<br>B)inflation<br>C)unemployment<br>D)unemployment.<br>E)economic growth<br>F)economic
Q77: (Table: Smartwatch GDP in Singapore). Use
Q78: When the U.S. government buys goods and
Q79: If an economy's GDP is $3.179 trillion
Q80: For each of these scenarios, calculate the
Q81: What is the difference between spending from