Multiple Choice
(Figure: Market 3) Use the graph to answer the question.
The graph shows the marginal social cost, demand, and supply curves in the toothpaste market. What is the socially optimal quantity and price in this market?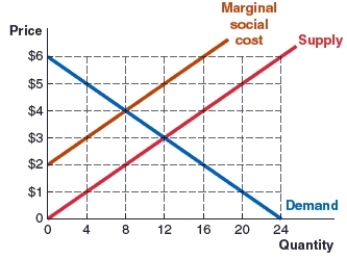
A) eight; $4
B) 12; $3
C) four; $6
D) three; $12
Correct Answer:

Verified
Correct Answer:
Verified
Related Questions
Q197: Pollution may be the best example of
Q198: How can the tragedy of the commons
Q199: The free-rider problem results from:<br>A)the inability to
Q200: (Figure: MSC and MPC Curves) Use the
Q201: The outcome that is most efficient for
Q203: (Market 6) Use the graph to answer
Q204: What type of good is rival and
Q205: What determines whether a corrective tax or
Q206: The marginal social cost is:<br>A)the extra cost
Q207: Costs that arise from a market transaction