Multiple Choice
(Figure: Market 5) Use the graph to answer the question.
The graph shows the marginal social benefit, demand, and supply curves in the toothbrush market. What are the socially optimal quantity and price?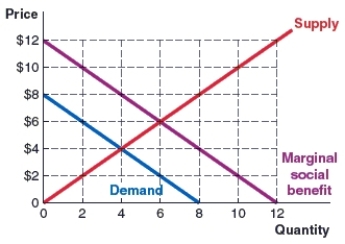
A) four; $4
B) eight; $8
C) six; $6
D) four; $8
Correct Answer:

Verified
Correct Answer:
Verified
Q17: A good has a free-rider problem when:<br>A)any
Q18: Which of the following would be both
Q19: Which statement illustrates an environmental policy that
Q20: In general, a corrective subsidy:<br>A)will fail in
Q21: The marginal external cost is the:<br>A)extra cost
Q23: Externalities tend to occur because decision makers
Q24: Certain activities, such as bee pollination or
Q25: For all economies, the extra external cost
Q26: Which good BEST fits the characteristics of
Q27: Saleable licenses that permit bearers to emit