Multiple Choice
(Figure: Market 3) Use the graph to answer the question.
The graph shows the marginal social cost, demand, and supply curves in the cinnamon roll market. A corrective tax of _____ per unit will move the cinnamon roll market to the socially optimal output of _____ units.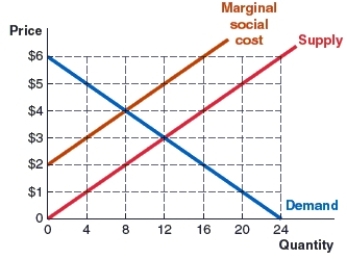
A) $3; 12
B) $2; 12
C) $4; 8
D) $2; 8
Correct Answer:

Verified
Correct Answer:
Verified
Q98: The tragedy of the commons is the:<br>A)destruction
Q99: (Figure: A Competitive Market in the Presence
Q100: The marginal private benefit curve is also
Q101: (Figure: A Competitive Market in the Presence
Q102: A market with negative externalities will tend
Q104: Describe the three-step recipe for analyzing externalities
Q105: With a system of cap and trade,
Q106: An externality is defined as:<br>A)the effect of
Q107: The Coase theorem states that the externality
Q108: (Figure: Market 4) Use the graph to