Multiple Choice
(Figure: Market 3) Use the graph to answer the question.
The graph shows the marginal social cost, supply, and demand curves in the hand sanitizer market. At what quantity could the government set a quota to control this externality?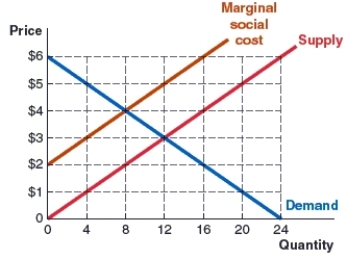
A) 2
B) 4
C) 8
D) 12
Correct Answer:

Verified
Correct Answer:
Verified
Q184: The BEST example of a public good
Q185: The marginal social benefit of flu shots
Q186: A corrective subsidy:<br>A)removes choice by requiring production
Q187: When your actions affect bystanders, then your
Q188: If the city government of Chicago decides
Q190: (Figure: MSB and Demand Curves 2) Use
Q191: When the lawn care services market is
Q192: (Figure: A Competitive Market in the Presence
Q193: Ollie considers the benefits and costs of
Q194: (Figure: Market) Use the graph to answer