Multiple Choice
(Figure: Market for Avocados) The figure shows the market for avocados. Which of the following is correct about this market between points A and B? 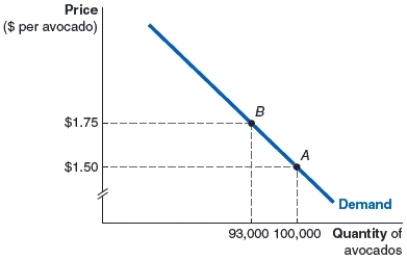
A) The demand curve is elastic, and thus the seller loses revenue by raising price from $1.50 to $1.75.
B) The demand curve is elastic, and thus the seller gains revenue by raising price from $1.50 to $1.75.
C) The demand curve is inelastic, and thus the seller loses revenue by raising price from $1.50 to $1.75.
D) The demand curve is inelastic, and thus the seller gains revenue by raising price from $1.50 to $1.75.
Correct Answer:

Verified
Correct Answer:
Verified
Q114: The price of milk at the local
Q115: Suppose the price of Cheerios rises by
Q116: The price of chicken breast rises from
Q117: Which statement is TRUE?<br>A)If the income elasticity
Q118: The price of product C is cut
Q120: (Figure: Supply Curves) The figure shows four
Q121: The price of a car wash falls
Q122: Good M has an income elasticity of
Q123: Explain four factors that affect the price
Q124: The price of a loaf of sourdough