Multiple Choice
(Figure: Demand Curve for Insulin) Use Figure: Demand Curve for Insulin. The figure shows a demand curve that is: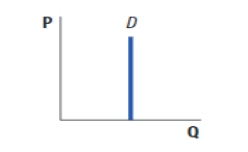
A) unit-elastic.
B) elastic.
C) perfectly inelastic.
D) perfectly elastic.
Correct Answer:

Verified
Correct Answer:
Verified
Related Questions
Q27: The price of milk at the local
Q28: (Table: Martinez Family Household Income and Expenditures)
Q29: You are given some data for four
Q30: Demand for soda outside an airport is
Q31: The income elasticity of demand for pears
Q33: If the price elasticity of supply is:<br>A)between
Q34: (Figure: Supply Curve for Hotel Rooms) Use
Q35: When the price of profiteroles increases from
Q36: The income elasticity of demand of a
Q37: When the price of profiteroles decreases from