Multiple Choice
Which of the following figures shows the impact of increased tariffs on automobile imports on the aggregate expenditure function?
A) 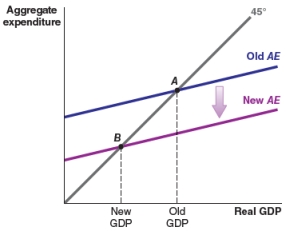
B) 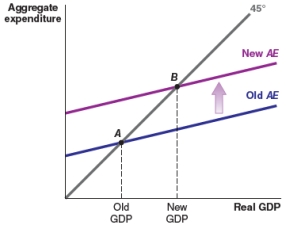
C) 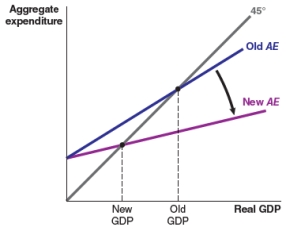
D) 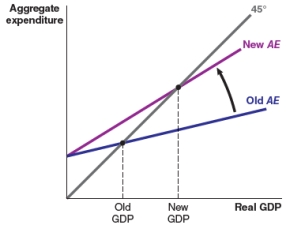
Correct Answer:

Verified
Correct Answer:
Verified
Related Questions
Q59: Which of the following figures shows the
Q60: Consider the following data. Based on
Q61: Which of the following scenarios shows the
Q62: In each of the following cases, identify
Q63: Consider the following data. What is
Q65: Consider the following data. What is
Q66: If the marginal propensity to consume is
Q67: The consumption function is:<br>A)the relationship between aggregate
Q68: A movement along the same aggregate expenditure
Q69: Planned investment refers to the:<br>A)total investment.<br>B)intentional expenditures