Multiple Choice
Which figure shows the impact of a rise in the marginal propensity to consume (MPC) on the aggregate expenditure function?
A) 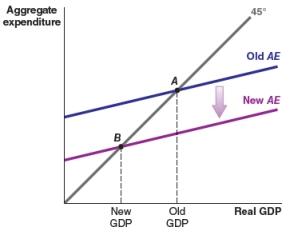
B) 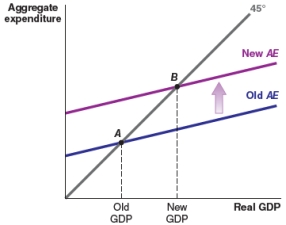
C) 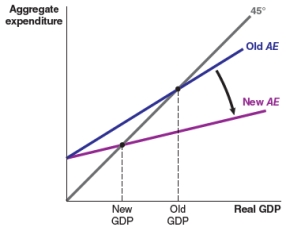
D) 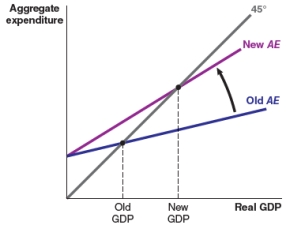
Correct Answer:

Verified
Correct Answer:
Verified
Related Questions
Q15: Consumption is $60 billion, investment is $54
Q16: If the marginal propensity to consume is
Q17: Consumption is $3,600 when income is $4,000,
Q18: If the federal government lowers government expenditure:<br>A)aggregate
Q19: If the marginal propensity to consume is
Q21: The difference between the multiplier effect and
Q22: Consumption refers to the:<br>A)purchases of goods and
Q23: Define the following concepts:<br>(a) marginal propensity to
Q24: Consumption is $5,900 when income is $6,000,
Q25: The marginal propensity to consume (MPC) is