Multiple Choice
In the graph below, all preintervention observations are less favorable than the post interventions observations; 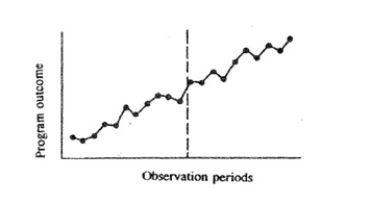
A) clearly the intervention had an impact.
B) regression to the mean is the most likely reason for the change.
C) the possible effects of maturation or history should be considered carefully.
D) partial correlations should be calculated before drawing any conclusions.
Correct Answer:

Verified
Correct Answer:
Verified
Q10: To show that a program had an
Q11: Using two time series with interventions delivered
Q12: If one selects the poorest readers from
Q13: Smoothing a graph of observations made over
Q14: The regression discontinuity design can be analyzed
Q16: A time series evaluation design leads to<br>A)
Q17: Suppose that a hospital made an effort
Q18: What would be some appropriate comparison groups
Q19: A most crucial concern in selecting additional
Q20: The ways in which evaluators expand on