Multiple Choice
Figure 3A
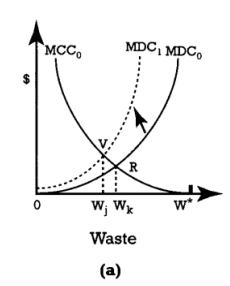
-Refer to Figure 3A. Assume that one starts at any point that indicates an optimal pollution level. Further assume that there is an educational campaign of awareness that results in a
change in social preference such that environmental quality is believed to be of utmost
importance - increasing its demand. Which panel or panels would indicate a movement in
the curves reflecting this social preference change?
A) Panel (a) only
B) Panel (b) only
C) Panel (c) only
D) Panels (a) and (c)
E) Panel (a) and (b)
Correct Answer:

Verified
Correct Answer:
Verified
Q1: Total economic value equals the sum of
Q3: Pollution output, in some form, can never
Q4: A poorly cared-for neighborhood park that reduces
Q5: Ecological economists always assume that greater utility
Q6: Generally, pollution reduces the capacity of an
Q7: Ocean fisheries is good example of a
Q8: Which one of the following is most
Q9: Hardin did recognize that the government can
Q10: Which one of the following statements about
Q11: Rational behavior requires making a trade-off between