Multiple Choice
Figure 7C
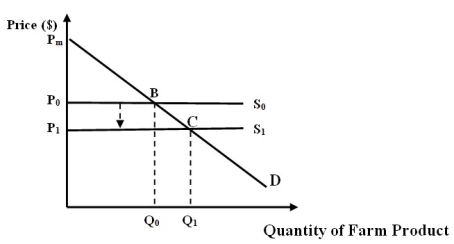
-Refer to Figure 7C. Assume that the farm product is grapes for wine-making. Also assume that the market for grapes is defined by the demand curve, D, and the supply curve, S1. Which of the following areas represents consumer surplus for this market?
A) Triangle pmcp1.
B) Triangle pmbp0.
C) Area P1BCP0.
D) None of these areas.
Correct Answer:

Verified
Correct Answer:
Verified
Q6: Consumers' surplus is the difference between what
Q7: One cannot carry out a contingent valuation
Q8: If a specific forest ecosystem service can
Q9: If the MDC depicts the amount society
Q10: Figure 7A<br> <img src="https://d2lvgg3v3hfg70.cloudfront.net/TBR1466/.jpg" alt="Figure 7A
Q12: Figure 7D<br> <img src="https://d2lvgg3v3hfg70.cloudfront.net/TBR1466/.jpg" alt="Figure 7D
Q13: Figure 7E<br> <img src="https://d2lvgg3v3hfg70.cloudfront.net/TBR1466/.jpg" alt="Figure 7E
Q14: Since economic valuation of benefit is based
Q15: Stated preference valuation methods differ from revealed
Q16: WTP and WTA are equivalent only if