Essay
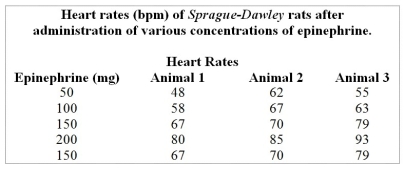
Table 1.1
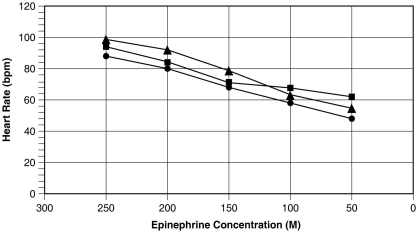
Figure 1.1
Use the table and graph below to answer the following questions.
-What is the reason for using a line graph to express the results of this study?
Correct Answer:

Verified
Line graphs are commonly used when the i...View Answer
Unlock this answer now
Get Access to more Verified Answers free of charge
Correct Answer:
Verified
View Answer
Unlock this answer now
Get Access to more Verified Answers free of charge
Q23: Table 1.1<br> <img src="https://d2lvgg3v3hfg70.cloudfront.net/TB1120/.jpg" alt="Table 1.1
Q24: What is the difference between a peer-reviewed
Q25: Adaptive significance is an important concept in
Q26: Which of the following are used to
Q27: There are 10 cloned horses, born on
Q29: Explain why the prefix homeo- is used
Q30: You are doing an experiment to determine
Q31: Table 1.1<br> <img src="https://d2lvgg3v3hfg70.cloudfront.net/TB1120/.jpg" alt="Table 1.1
Q32: The human environment is terrestrial, dry, and
Q33: The following is a list of several