Essay
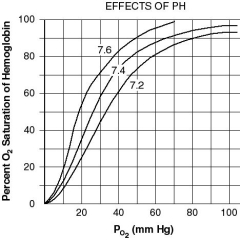
The graph below shows an oxygen dissociation curve, with the normal curve in the center.What is the name of the phenomenon that shifts the curve to the right? What causes this change in oxygen dissociation? Is the shift beneficial or detrimental? Explain.
Correct Answer:

Verified
The shift in the dissociation curve is c...View Answer
Unlock this answer now
Get Access to more Verified Answers free of charge
Correct Answer:
Verified
View Answer
Unlock this answer now
Get Access to more Verified Answers free of charge
Q72: Match the lung disease to its description.<br>-thickened
Q73: Specialized _ in the carotid and aortic
Q74: Jill lives in St.Louis, which is close
Q75: Match the lung disease to its description.<br>-destruction
Q76: Match the factor with its effect on
Q78: Match the lung disease to its description.<br>-increased
Q79: Inappropriate relaxation of the _ muscles during
Q80: Write the chemical equation catalyzed by the
Q81: Protective reflexes of the lungs include<br>A) coughing.<br>B)
Q82: An industrious 10-year-old swimmer has attached an