Multiple Choice
The illustration below represents.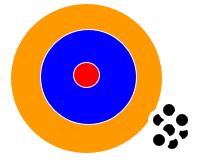
A) Validity
B) Reliability
C) Heterogeneity
D) Experimenter bias
Correct Answer:

Verified
Correct Answer:
Verified
Related Questions
Q6: A Cronbach's alpha value less than .50
Q7: A scale that has "strongly agree" and
Q8: A typical and widely cited benchmark for
Q9: Typically values for Cronbach's ? range from
Q10: The following is NOT an example of
Q12: Differentiate between semantic differential and Likert scales.
Q13: Negative values for Cronbach's alpha are technically
Q14: Researchers often use Likert scales with _
Q15: For a scale to be reliable it
Q16: With ordinal scales, the data tabulation typically