Multiple Choice
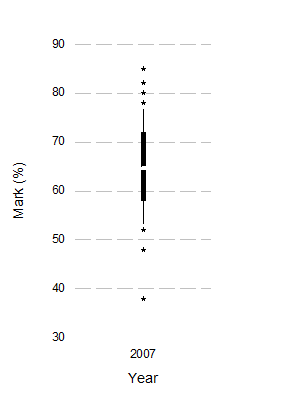
-Based on the above chart, what was the inter-quartile range of marks (approximately) ?
A) 7%
B) 14%
C) 47%
D) 22%
Correct Answer:

Verified
Correct Answer:
Verified
Q1: How would you describe the frequency distribution
Q2: Below is a frequency distribution from www.amazon.co.uk
Q4: Below is a frequency distribution from www.amazon.co.uk
Q5: Below is a frequency distribution from www.amazon.co.uk
Q6: Below is a frequency distribution from www.amazon.co.uk
Q7: What is the relationship between the sum
Q8: <img src="https://d2lvgg3v3hfg70.cloudfront.net/TBR1119/.jpg" alt=" -Below is a
Q9: <img src="https://d2lvgg3v3hfg70.cloudfront.net/TBR1119/.jpg" alt=" -Based on the
Q10: Below is a frequency distribution from www.amazon.co.uk
Q11: Below is a frequency distribution from www.amazon.co.uk