Essay
Below are the histograms for the test scores for two tests (for the same class). 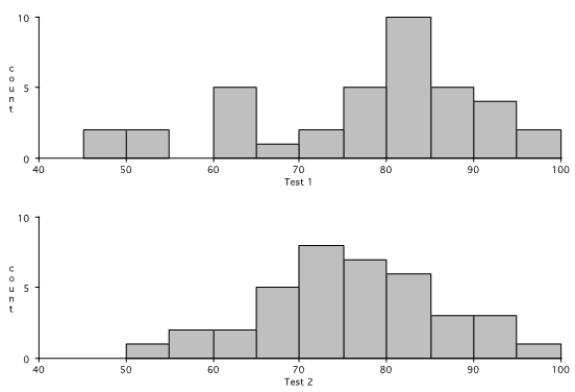
What can you tell about the performances on the two tests from the histograms?
Correct Answer:

Verified
Correct Answer:
Verified
Related Questions
Q1: Below is a scatter plot of the
Q2: Consider the following box plots for the
Q3: Sketch a scatter plot of two variables
Q4: This rating chart of low-priced CD
Q5: Predict whether the correlation coefficient for each
Q7: Below are the box plots for the
Q8: Consider the following histograms for the scores