Essay
Box-and-whiskers plots for a sample of students and their number of hours of sleep per night during the week are given below. (Data adapted from DataScope.) 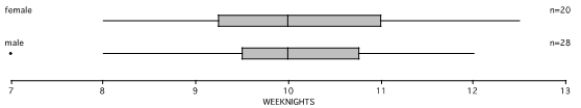
A) Why is the one dot for a male student separate from the rest of the graph?
B) How many female students sleep more than 11 hours?
C) How many male students sleep between 10 and 10.75 hours?
D) Do any females sleep longer than all the males? Explain.
E) Give the interquartile range for the males.
F) Give the five-number summary for the females.
G) If the female and male data were put together, what would be the median number of hours of sleep? Explain how you know or why you can't tell.
Correct Answer:

Verified
A) The dot represents an outlier (more t...View Answer
Unlock this answer now
Get Access to more Verified Answers free of charge
Correct Answer:
Verified
View Answer
Unlock this answer now
Get Access to more Verified Answers free of charge
Q22: A circle graph (pie chart) can be
Q23: A) Make a box plot for
Q24: A particular medicine is not effective if
Q25: Suppose that the class mean on a
Q26: The median, rather than the mean or
Q27: Calculate the standard deviation for these scores:
Q28: Of the 1000 scores on a test,
Q29: Make a box-and-whiskers plot for these 24
Q31: Make a bar graph for the
Q32: The mean is affected more by an