Multiple Choice
Use the following to answer questions below:
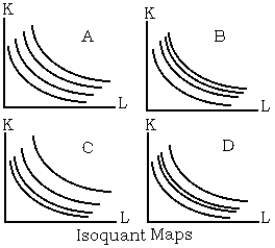
-Refer to the isoquant maps graph. Assume that the four isoquants in each graph represent output levels of 100, 200, 300, and 400. Which of the four graphs shows an isoquant map in which returns to scale are continuously increasing?
A) Graph A
B) Graph B
C) Graph C
D) None of the above is correct.
Correct Answer:

Verified
Correct Answer:
Verified
Q54: The point of inflection on the total
Q55: The combination of inputs is optimal<br>A) at
Q56: Production function can be represented as<br>A) an
Q57: The average product of labor is equal
Q58: Having a Cobb-Douglas production function with parameters
Q60: Given: Q = 100K0.5L0.5, C* = $1,000,
Q61: The table below presents estimates of
Q62: Which of the following is not a
Q63: Inputs that cannot be easily varied during
Q64: Use the following to answer questions below:<br>