Multiple Choice
Use the following to answer questions below:
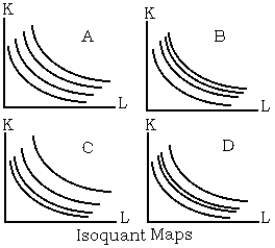
-Refer to the isoquant maps graph. Assume that the four isoquants in each graph represent output levels of 100, 200, 300, and 400. Which of the four graphs shows an isoquant map in which returns to scale are continuously decreasing?
A) Graph A
B) Graph B
C) Graph C
D) None of the above is correct.
Correct Answer:

Verified
Correct Answer:
Verified
Q34: Use the following to answer questions below:<br>
Q35: If the sum of the output elasticities
Q36: The firm hires 10 new employees and
Q37: The production function is an equation, table,
Q38: The marginal product of labor is equal
Q40: A firm currently employs 45 production workers
Q41: A country that has an abundance of
Q42: When an input's average product exceeds its
Q43: The law of diminishing returns is a
Q44: The firm hires 100 new employees and