Multiple Choice
Use the following to answer questions below:
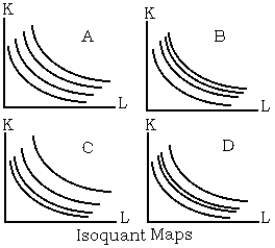
-Refer to the isoquant maps graph. Assume that the four isoquants in each graph represent output levels of 100, 200, 300, and 400. Which of the four graphs shows an isoquant map in which returns to scale are first decreasing and then increasing?
A) Graph D
B) Graph C
C) Graph B
D) None of the above is correct.
Correct Answer:

Verified
Correct Answer:
Verified
Q11: Use the following to answer questions below:<br>
Q12: In general, a firm should continue to
Q13: The table below presents estimates of
Q14: When total product is at its highest
Q15: One advantage of the use of the
Q17: The marginal rate of technical substitution measures
Q18: Which of the following is not an
Q19: Use the following to answer questions below:<br>
Q20: The law of diminishing returns holds that
Q21: Given: Q = 100K0.5L0.5, C* = $1,000,