Multiple Choice
The scatter diagram represents a data set and a plot of the simple linear regression equation estimated from the data. The diagram shows evidence of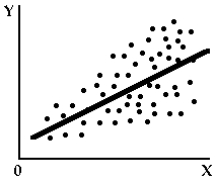
A) homoscedasticity.
B) heteroscedasticity.
C) positive autocorrelation.
D) negative autocorrelation.
Correct Answer:

Verified
Correct Answer:
Verified
Related Questions
Q28: Using consumer clinics approach, data is obtained
Q29: A scatter diagram is a graph of
Q30: You have found the b estimate
Q31: The estimation of consumer demand by questioning
Q32: The application of multiple regression analysis to
Q34: Fill in the remaining information and
Q35: If the absolute value of the t
Q36: A market experiment is carried out by
Q37: The significance level of a t test
Q38: A simple linear regression analysis based on