Multiple Choice
The scatter diagram represents the error terms from a simple linear regression estimated from time-series data. The error terms are plotted against time. The diagram shows evidence of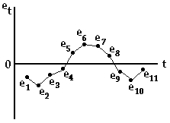
A) homoscedasticity.
B) heteroscedasticity.
C) positive autocorrelation.
D) negative autocorrelation.
Correct Answer:

Verified
Correct Answer:
Verified
Q1: The standard error of the regression measures
Q2: If the price of a commodity rises
Q3: Using observational research approach, data is obtained
Q5: Analysis of variance tests the explanatory power
Q6: Calculate the equation of the linear function
Q7: Heteroscedasticity refers to a situation in which
Q8: A multiple regression analysis based on a
Q9: Application of simple linear regression analysis to
Q10: Using consumer survey approach, data is obtained
Q11: The Y intercept of a linear function