Essay
Figure 10.6
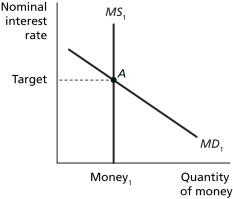
-Refer to Figure 10.6.Suppose the economy is originally in equilibrium at point A in the above figure.Explain what happens to the money supply and money demand if real GDP increases and changes the output gap if the Bank of Canada wants to keep the nominal interest rate at its target,and show these changes on the money market graph.Use the new money market graph to derive an MP curve.
Correct Answer:

Verified
The increase in real GDP will increase t...View Answer
Unlock this answer now
Get Access to more Verified Answers free of charge
Correct Answer:
Verified
View Answer
Unlock this answer now
Get Access to more Verified Answers free of charge
Q35: Assume the economy is initially in equilibrium
Q36: Figure 10.8<br> <img src="https://d2lvgg3v3hfg70.cloudfront.net/TB4177/.jpg" alt="Figure 10.8
Q37: Suppose that the economy is experiencing inflation
Q38: Table 10.1<br> <span class="ql-formula" data-value="\begin{array}
Q39: Figure 10.1<br> <img src="https://d2lvgg3v3hfg70.cloudfront.net/TB4177/.jpg" alt="Figure 10.1
Q41: Table 10.1<br> <span class="ql-formula" data-value="\begin{array}
Q42: If the MPC = 0.75,a decrease in
Q43: Assume the economy is initially in equilibrium
Q44: Equilibrium in the goods market occurs where<br>A)
Q45: Expansionary monetary policy causes a _ the