Multiple Choice
Figure 10.8
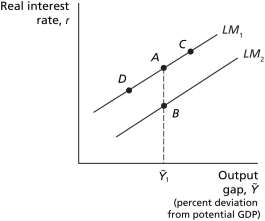
-Refer to Figure 10.8..Other things equal,an increase in the price level would best be represented by
A) a movement from point A to point C.
B) a movement from point A to point D.
C) a shift from LM₁ to LM₂.
D) a shift from LM₂ to LM₁.
Correct Answer:

Verified
Correct Answer:
Verified
Q21: The aggregate demand curve is all of
Q22: Figure 10.8<br> <img src="https://d2lvgg3v3hfg70.cloudfront.net/TB4177/.jpg" alt="Figure 10.8
Q23: The Bank of Canada has control over
Q24: Table 10.1<br> <span class="ql-formula" data-value="\begin{array}
Q25: Figure 10.2<br> <img src="https://d2lvgg3v3hfg70.cloudfront.net/TB4177/.jpg" alt="Figure 10.2
Q27: If the long-term real interest rate is
Q28: If the MPC = 0.80,the government purchases
Q29: For each of the following changes,identify whether
Q30: List three factors that will cause the
Q31: If the MPC = 0.80,the tax multiplier