Multiple Choice
Figure 10.9
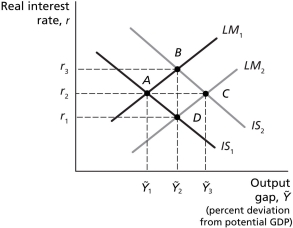
-Refer to Figure 10.9..Other things equal,a decrease in the nominal money supply by the Bank of Canada is best represented as a change in equilibrium from
A) point A to point B.
B) point A to point D.
C) point C to point B.
D) point C to point D.
Correct Answer:

Verified
Correct Answer:
Verified
Q2: Figure 10.5<br> <img src="https://d2lvgg3v3hfg70.cloudfront.net/TB4177/.jpg" alt="Figure 10.5
Q3: Which of the following best represents the
Q4: Figure 10.8<br> <img src="https://d2lvgg3v3hfg70.cloudfront.net/TB4177/.jpg" alt="Figure 10.8
Q5: Figure 10.3<br> <img src="https://d2lvgg3v3hfg70.cloudfront.net/TB4177/.jpg" alt="Figure 10.3
Q6: Using the IS-MP model,explain what happens to
Q8: Figure 10.8<br> <img src="https://d2lvgg3v3hfg70.cloudfront.net/TB4177/.jpg" alt="Figure 10.8
Q9: Figure 10.5<br> <img src="https://d2lvgg3v3hfg70.cloudfront.net/TB4177/.jpg" alt="Figure 10.5
Q10: Holding other factors constant,a decline in incomes
Q11: A positive demand shock causes a _
Q12: Changes in the real interest rate affect