Multiple Choice
Figure 11.2
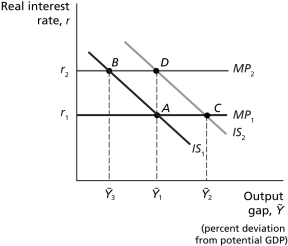
-Refer to Figure 11.2...Assume the economy is in equilibrium at Ȳ₁,where real GDP equals potential GDP.The economy experiences a positive demand shock,and the Bank of Canada responds by increasing real interest rates to bring real GDP and inflation back to their original levels.Other things equal,the positive demand shock is best represented by am initial movement from
A) point A to point B.
B) point A to point C.
C) point D to point B.
D) point D to point C.
Correct Answer:

Verified
Correct Answer:
Verified
Q64: How does the open-economy IS-MP model incorporate
Q65: Explain the differences between the shocks that
Q66: An increase in the unemployment rate that
Q67: A Phillips curve shows the short-run relationship
Q68: An increase in the unemployment rate that
Q69: An increase in the real interest rate
Q71: The Phillips curve will shift down with
Q72: Positive demand shocks have a tendency to
Q73: Suppose the economy is in equilibrium with
Q74: Once the Phillips curve has shifted down,the