Multiple Choice
Figure 11.2
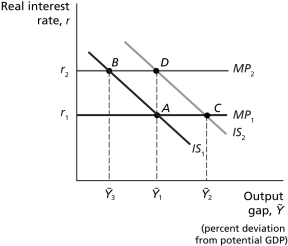
-Refer to Figure 11.2..Assume the economy is in equilibrium at Ȳ₁,where real GDP equals potential GDP,and then the economy experiences a positive demand shock.Other things equal,the positive demand shock is best represented by a(n)
A) movement up along the Phillips curve.
B) movement down along the Phillips curve.
C) upward shift of the Phillips curve.
D) downward shift of the Phillips curve.
Correct Answer:

Verified
Correct Answer:
Verified
Q46: The oil shock of 2007-2008 saw the
Q47: Under a fixed exchange rate system,at high
Q48: The oil shock of 2007-2008 saw the
Q49: Under a fixed exchange rate system,at high
Q50: Under a fixed exchange rate system,if the
Q52: Assume the economy is in equilibrium at
Q53: An increase in the real interest rate
Q54: Figure 11.2<br> <img src="https://d2lvgg3v3hfg70.cloudfront.net/TB4177/.jpg" alt="Figure 11.2
Q55: An increase in the real interest rate
Q56: A decrease in the unemployment rate that