Multiple Choice
Figure 14.1
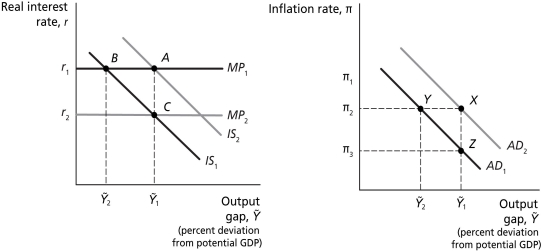
-Refer to Figure 14.1.Other things equal,an increase in the inflation rate is best represented as a movement from
A) point A to point B.
B) point C to point A.
C) point C to point B.
D) point B to point C.
Correct Answer:

Verified
Correct Answer:
Verified
Q47: Figure 14.3<br> <img src="https://d2lvgg3v3hfg70.cloudfront.net/TB4177/.jpg" alt="Figure 14.3
Q48: In general,a formula that a central bank
Q49: Suppose the economy is initially in equilibrium
Q50: Assume that the Bank of Canada has
Q51: What are rational expectations,and how might rational
Q53: Figure 14.2<br> <img src="https://d2lvgg3v3hfg70.cloudfront.net/TB4177/.jpg" alt="Figure 14.2
Q54: Suppose the Bank of Canada has a
Q55: Figure 14.1<br> <img src="https://d2lvgg3v3hfg70.cloudfront.net/TB4177/.jpg" alt="Figure 14.1
Q56: Suppose the Bank of Canada has a
Q57: Figure 14.1<br> <img src="https://d2lvgg3v3hfg70.cloudfront.net/TB4177/.jpg" alt="Figure 14.1