Multiple Choice
Figure 14.3
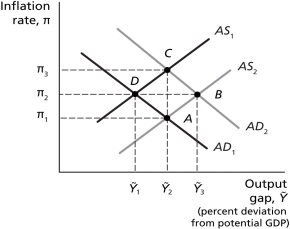
-Refer to Figure 14.3.Suppose the economy is initially at long-run equilibrium and the Bank of Canada increases the target inflation rate,and to hit this rate,it must reduce the real interest rate.The economy then reaches a new,short-run equilibrium point.Assuming expectations are adaptive,the next movement is best represented as a movement from
A) point C to point B.
B) point C to point A.
C) point D to point C.
D) point B to point C.
Correct Answer:

Verified
Correct Answer:
Verified
Q1: Figure 14.2<br> <img src="https://d2lvgg3v3hfg70.cloudfront.net/TB4177/.jpg" alt="Figure 14.2
Q2: The aggregate supply curve shows the total
Q3: An increase in the inflation rate results
Q4: Many economists believe the central banks were
Q5: Figure 14.2<br> <img src="https://d2lvgg3v3hfg70.cloudfront.net/TB4177/.jpg" alt="Figure 14.2
Q7: Figure 14.3<br> <img src="https://d2lvgg3v3hfg70.cloudfront.net/TB4177/.jpg" alt="Figure 14.3
Q8: The short-run effect of a negative supply
Q9: A combination of high inflation and recession,usually
Q10: Assume that the Bank of Canada has
Q11: Figure 14.2<br> <img src="https://d2lvgg3v3hfg70.cloudfront.net/TB4177/.jpg" alt="Figure 14.2