Multiple Choice
Based on the following graphical summary display,what research design was used to record and analyze these data?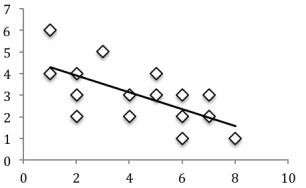
A) correlational
B) experimental
C) quasi-experimental
D) either experimental or quasi-experimental
Correct Answer:

Verified
Correct Answer:
Verified
Related Questions
Q70: Inferential statistics is used to determine if
Q71: Researchers measure data in a _ to
Q72: A professor measures the number of review
Q73: Descriptive statistics is a branch of mathematics
Q74: Which of the following research designs is
Q76: The number of students in a class
Q77: In some cases,the number of participants in
Q78: A social psychologist interested in the expression
Q79: Which of the following best describes an
Q80: Only an experiment can demonstrate cause-and-effect relationships