Multiple Choice
State the type of graphical display for Graph A and GraphB. 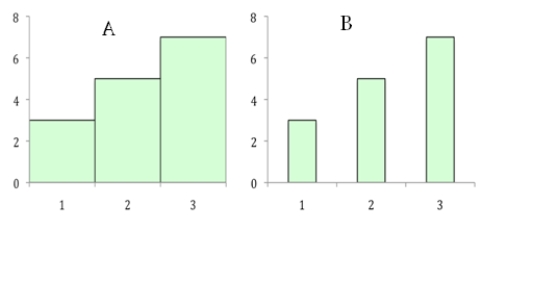
A) A is a bar chart; B is a histogram.
B) B is a bar chart; A is a histogram.
C) Both graphs are bar charts.
D) Both graphs are histograms.
Correct Answer:

Verified
Correct Answer:
Verified
Related Questions
Q9: The three steps for constructing a simple
Q10: To determine the interval width,we divide the
Q11: What is the percentile point at the
Q12: When cumulating frequencies from the bottom up,the
Q13: Fill in the missing values for A
Q15: Twelve percent of students scored at or
Q16: Which of the following is a type
Q17: The following is a simple frequency distribution
Q18: A psychologist wants to know how many
Q19: A student scores in the 80th percentile