Multiple Choice
The following graphs display the data points for two linear correlations.Based on the information provided in these graphs,______ displays a negative correlation and ______ displays a stronger correlation.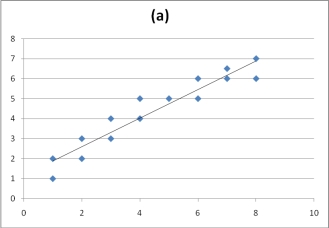
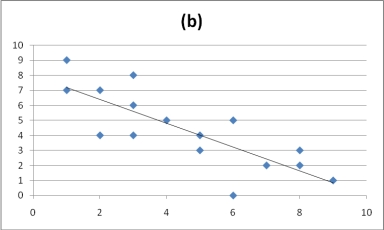
A) Graph A, Graph B
B) Graph B, Graph A
C) Graph A, Graph A
D) Graph B, Graph B
Correct Answer:

Verified
Correct Answer:
Verified
Q68: Which of the following is a limitation
Q69: The phi correlation coefficient is used to
Q70: A researcher measures the correlation in rankings
Q71: Select the description below that identifies the
Q72: Which of the following indicates the strongest
Q74: To summarize correlations,we report the strength,the direction,and
Q75: If r = .25,then the coefficient of
Q76: A researcher measures the correlation between the
Q77: The phi correlation coefficient is a measure
Q78: The correlation coefficient can be converted to